Join CRPE for a webinar on the 2026 State of the American Student Report on November 9 at 10:00 a.m. Pacific.

The State of the
American Student
2O26
As the federal government continues to step back on education, all eyes are on states to lead. We set out to find out what states are doing to meet this moment—and whether their efforts are likely to work.

Fast Facts & Situation Report
We’ve got to go far beyond normal to help students catch up.
– Thomas Kane, Harvard University
Six years after the pandemic, academic recovery has failed for the vast majority of students, especially the most vulnerable.
Share of US students in districts that have recovered to pre-pandemic achievement in both math and reading
Change in the nation’s eighth-grade math scores since 2022
States that have returned to pre-pandemic attendance levels
But the problem is bigger than pandemic recovery.
The year American academic achievement began to decline nationally
Teachers who reported experiencing burnout in 2026
Change in the share of fourth graders with disabilities scoring at least “Basic” on NAEP math
Pressures on schools and districts are mounting.
Number of states where enrollment has declined since the mid-2010s
The World Economic Forum projects AI will displace 92 million jobs while creating 170 million new ones. Today’s students will enter a labor market being remade in real time.
Every state has work to do.
Federal leadership is weakening, and all eyes are on states.
Staff reductions and pullback at the Department of Education have raised real concerns about federal capacity to enforce civil rights and special education law, even as the administration pushes more responsibility onto states.

The Goal Gap
Most states haven’t clearly said what they’re trying to achieve, and the ones that have are focused on core academics.
CRPE scanned all 50 states for statewide learning goals prominent enough that a parent or teacher could actually find them—in state education agency websites, strategic plans, or a governor’s address, not buried in a technical document.
Why do goals matter?
A goal that isn’t specific and time-bound is hard to measure, and one that isn’t publicly visible is hard to enforce. Without a clear, findable target, parents and advocates have no benchmark to hold schools and state leaders accountable to, and state leaders have less pressure to prioritize the work of hitting it.
The Policy Gap
If most states are setting goals to improve reading, math, and postsecondary outcomes, then we should expect to see states taking certain steps:
Improving literacy instruction.
Improving math instruction.
Linking K-12 education to career pathways.
Sharing guidance and creating policy on AI.
CRPE drew on over a dozen state scans from reputable research, advocacy, and journalism organizations to investigate what all 50 states are doing in each of these four areas.

Literacy reform shows nationwide momentum, but uneven follow-through.
Since 2013, 43 states and DC have passed a science of reading law. But implementation is shallower than the laws suggest: only eight states are “fully” implementing a majority of ExcelinEd’s 18 early literacy principles.
Math is a weak spot for nearly every state.
Eighteen states and DC have passed math reform laws since 2022, but 37 states aren’t “fully” implementing a single one of ExcelinEd’s 11 recommended policies for improving student math outcomes.


Career pathway policies are getting traction but remain underdeveloped.
Only six states (Iowa, Maryland, Rhode Island, Tennessee, Virginia, and Washington) have adopted a majority of the 19 policies Jobs for the Future considers necessary for robust career navigation systems, and 31 states have implemented a third or fewer.
States are moving fast on AI, with 36 states publishing or endorsing guidance. But guidance is not the same as policy and leadership.
The majority of state guidance is advisory, not mandatory, and almost none have built the capacity or funding to help districts, especially the smallest and least-resourced ones, actually meet the expectations they’ve set. Meanwhile, the growing movement to limit technology in schools is testing how states approach AI.

Some states show almost no evidence of action across any of these four policy areas, including red states like South Dakota, purple states like New Hampshire, and blue states like New York. Others, like Tennessee and Maryland, score well across multiple areas but still have gaps.
The Partisan Split
Where state strategies diverge, they tend to split along partisan lines.
Red states are taking the most aggressive action on instructional reform. On two separate literacy frameworks (one from the Albert Shanker Institute and the other from ExcelinEd), red states score higher on average, blue states score lower, and purple states fall in the middle. The same partisan split shows up in math, only more starkly: 13 of the 18 states that have enacted math bills since 2022 are red, and only two are blue.
Two other major areas are sharply partisan: school choice and student well-being. Twenty states, sixteen red and four purple, have enacted education savings accounts or tax credits since 2019. Student well-being is the single most active area of Democratic-led policymaking in education—72% of well-being bills introduced since 2022 were sponsored by Democrats.
But neither side has a full solution.
Red states pushing hardest on instruction are often simultaneously expanding private school choice with little accountability for whether the two strategies reinforce or undercut each other.
Blue states are focusing much of their efforts on well-being while tiptoeing around issues with core instruction.
Results also vary, even when policies are similar.
Mississippi, Louisiana, and Alabama are posting real academic gains, while Florida, with similarly comprehensive instructional reforms (but a much larger private choice market), ranks last among states in reading recovery.
Variation Between States
Variation between higher- and lower-performing states is growing.
It’s not a good time to follow the party line—it’s a good time to do what works. The stakes are getting higher. For nearly two decades, the variation in academic achievement between states had been shrinking. But since 2019, that trend has reversed. States are pulling apart, not coming together, and the pattern is clearest in eighth-grade math and reading. The ridgeline figure below tells the story in three chapters.For two decades, the bipartisan standards movement helped narrow the gap between higher- and lower-performing states, even as national achievement began declining after 2013. Since 2019, that trend has reversed. States are pulling apart, not coming together, and the pattern is clearest in eighth-grade math and reading.
How to read this graphic
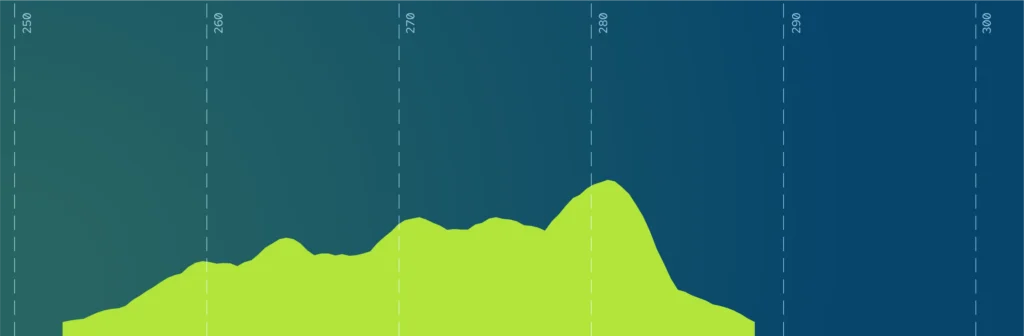
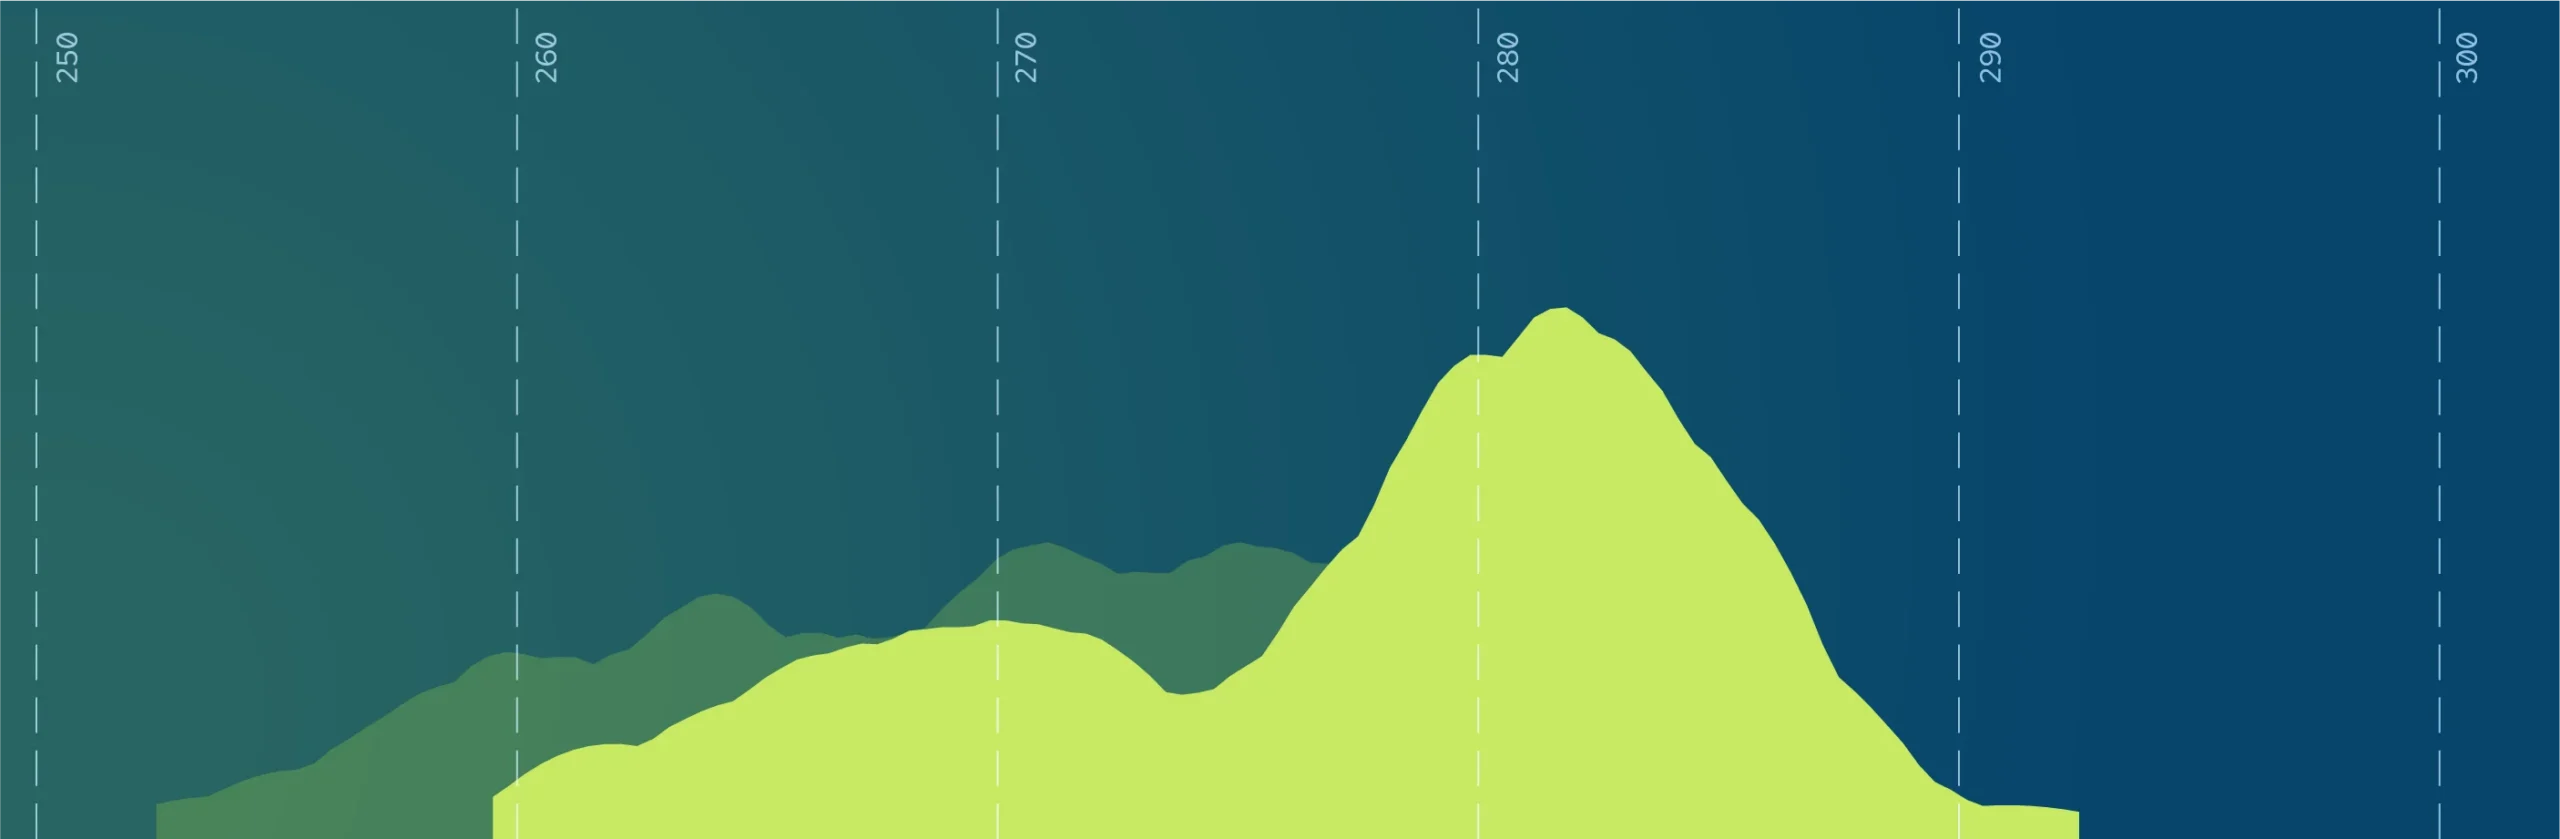
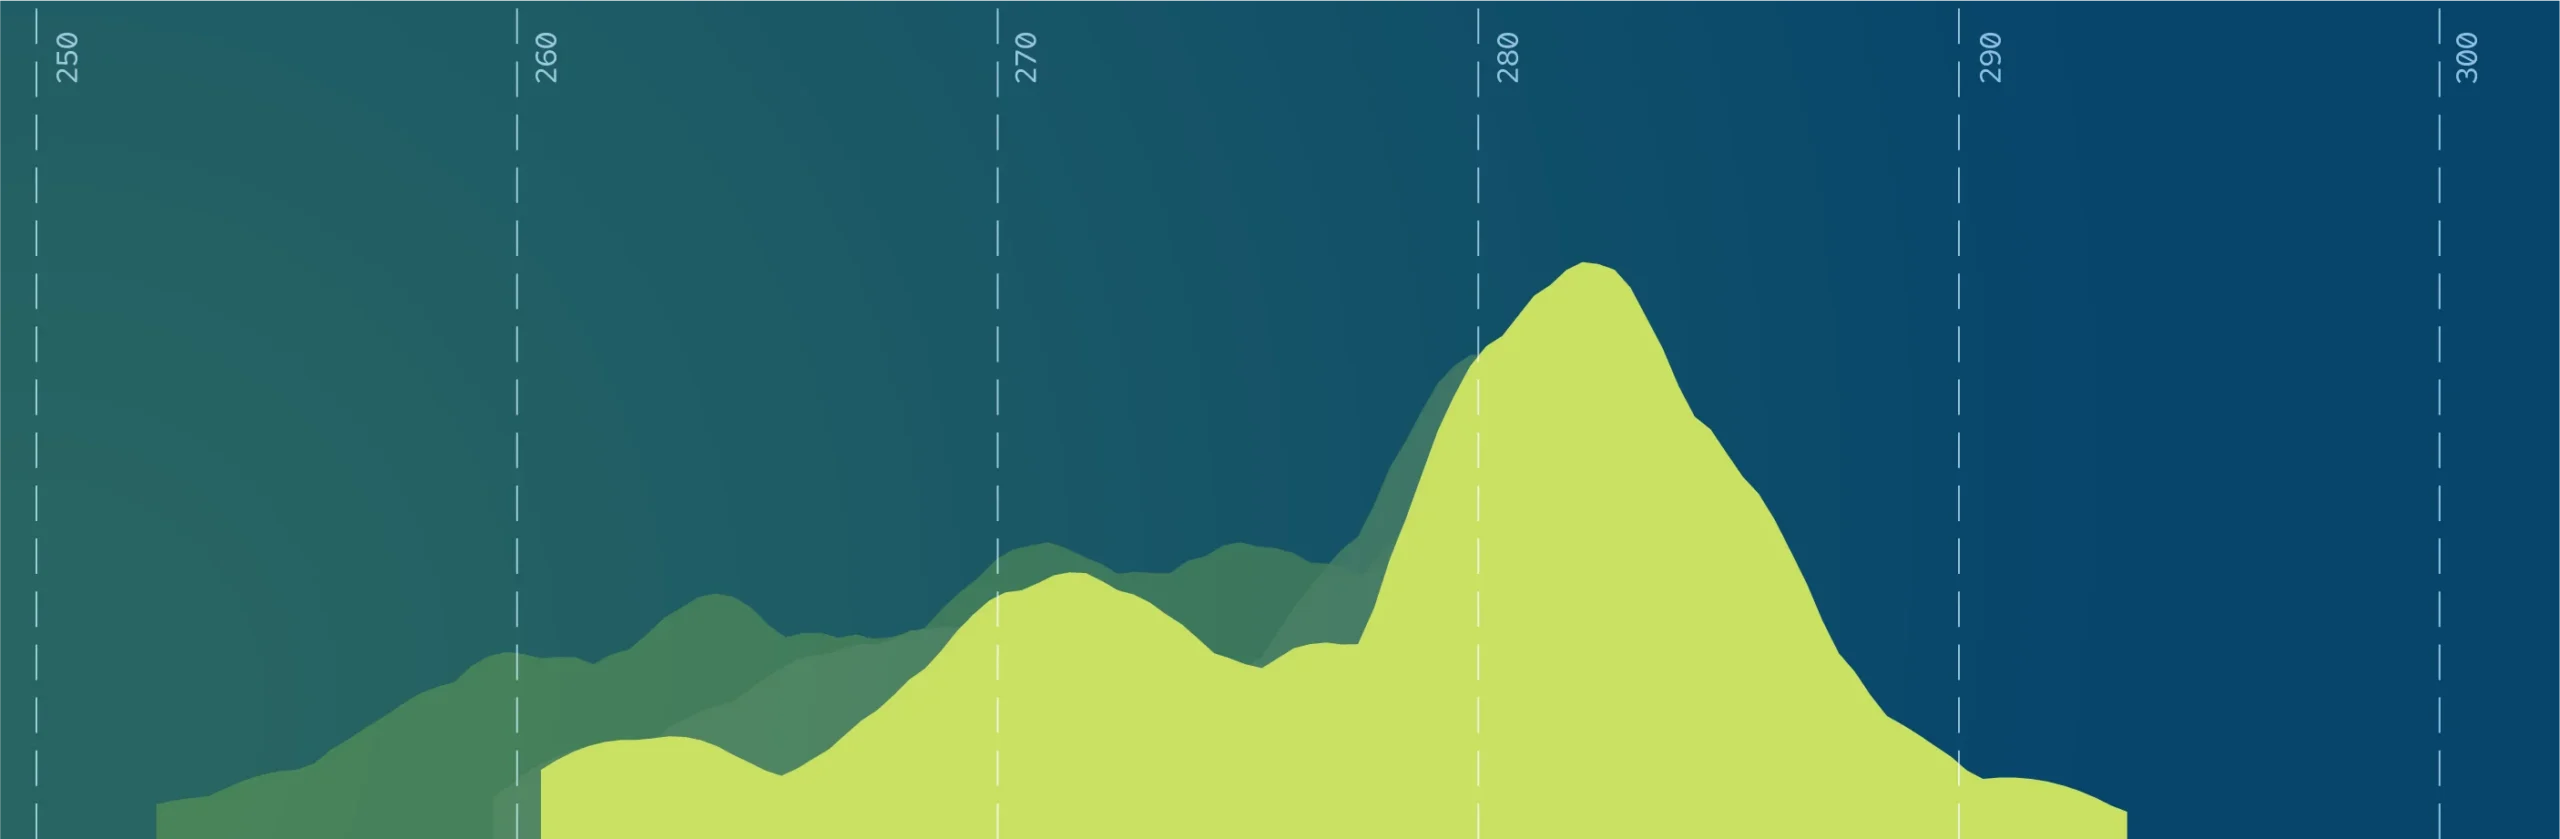
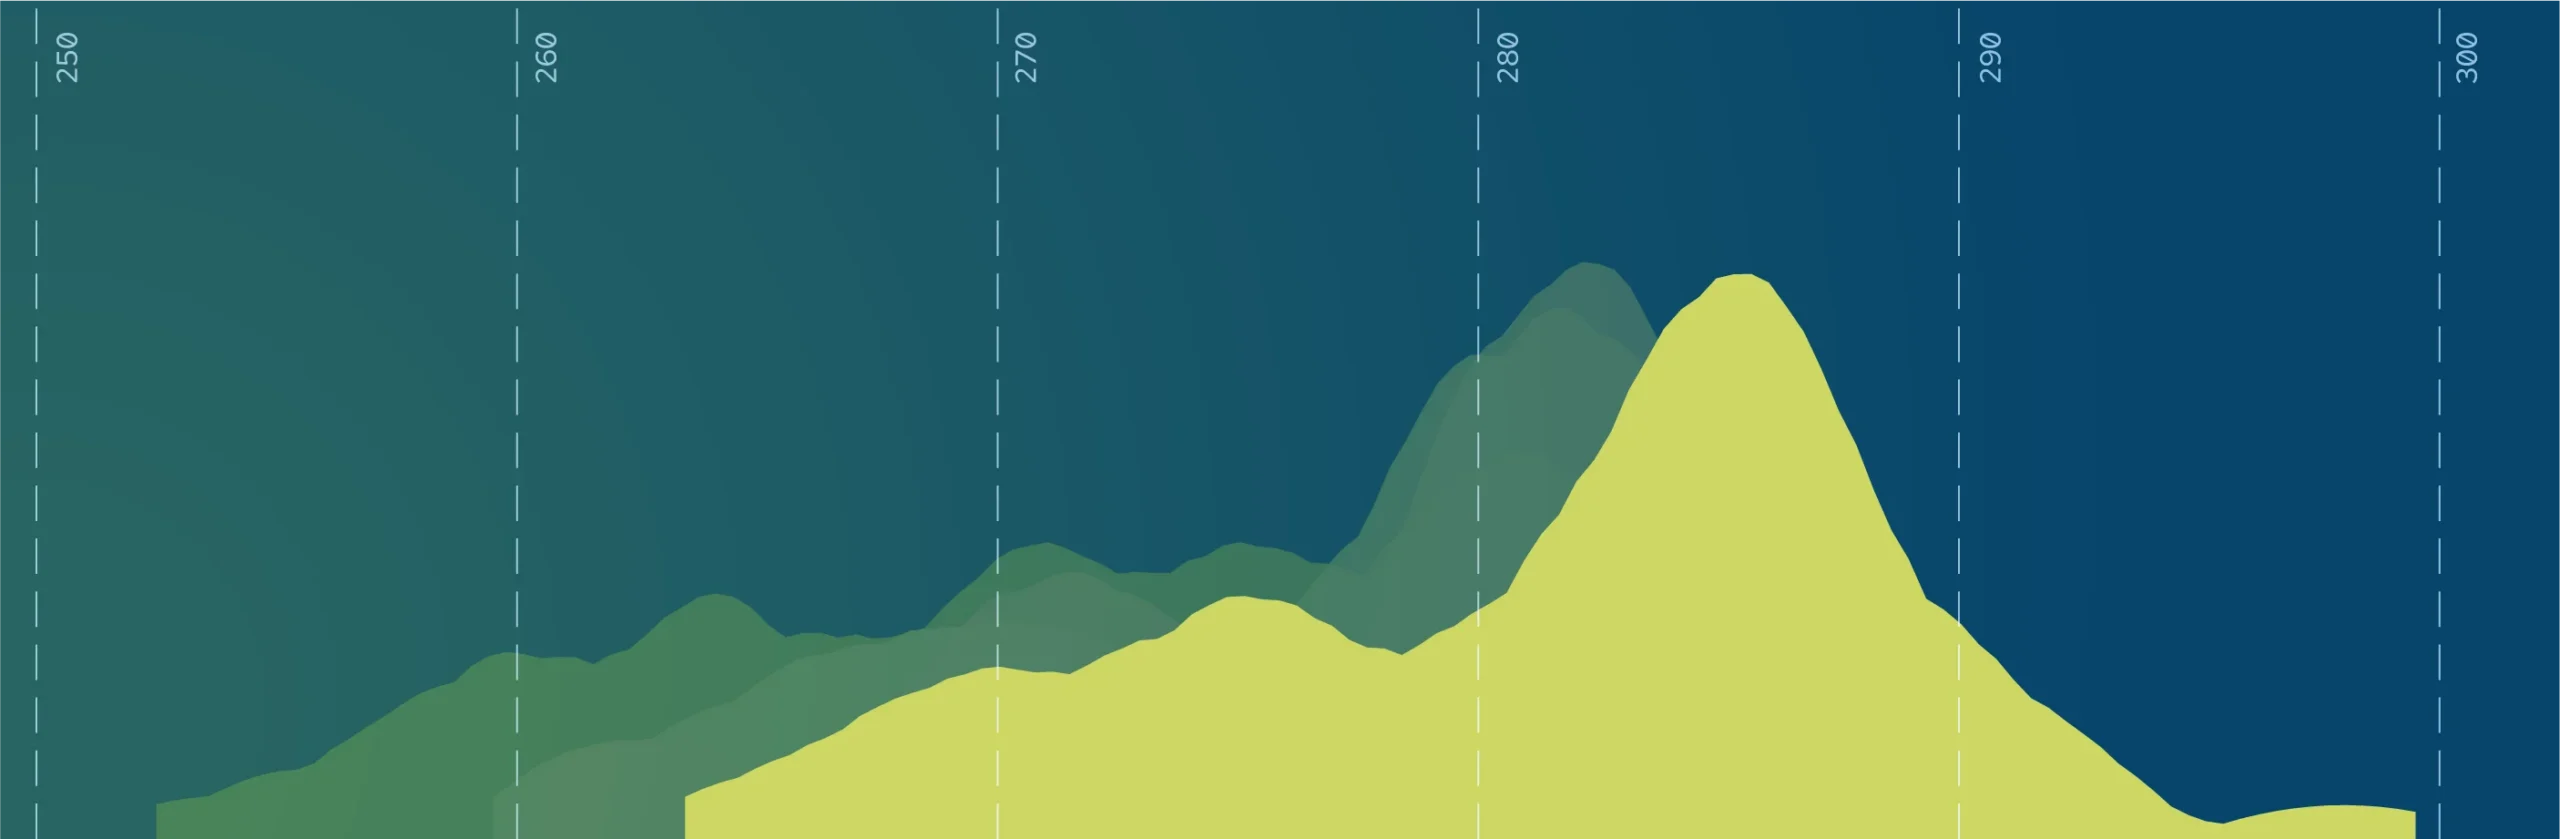
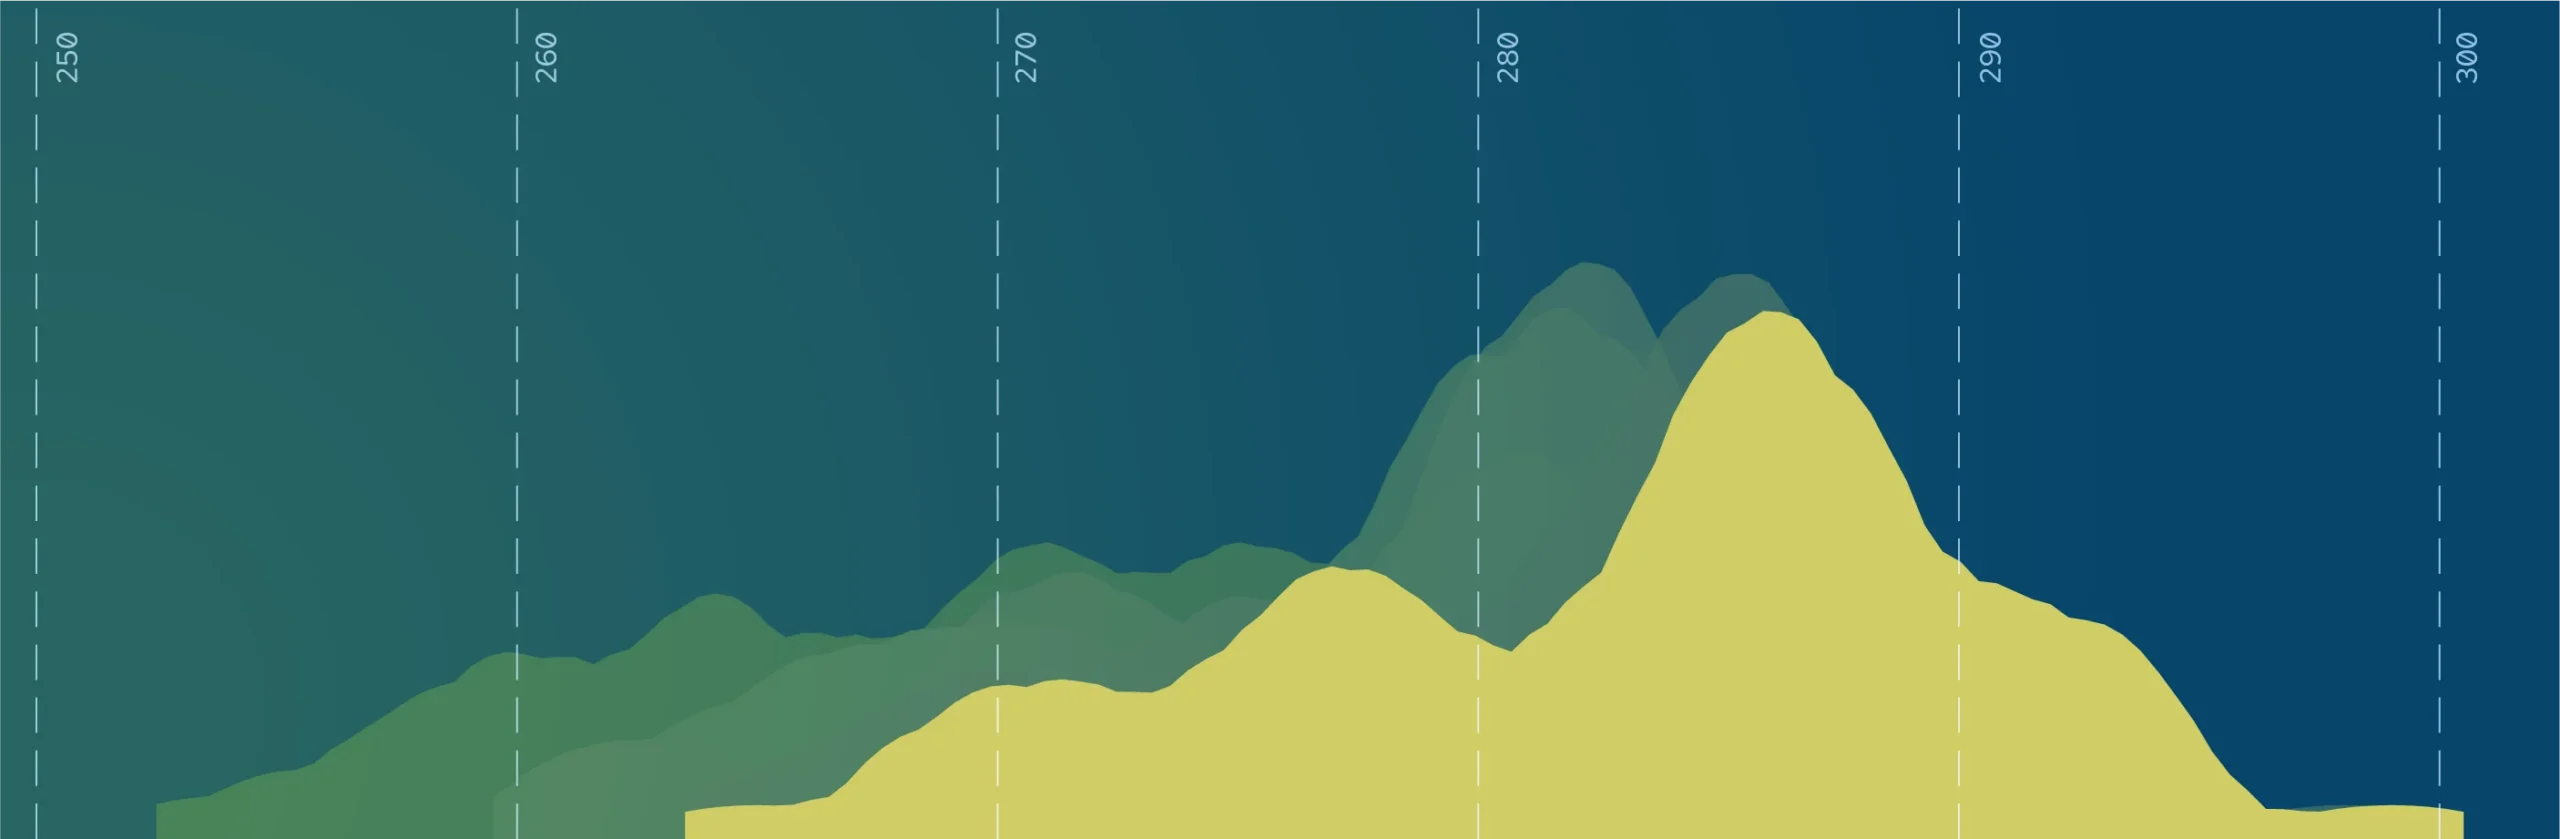
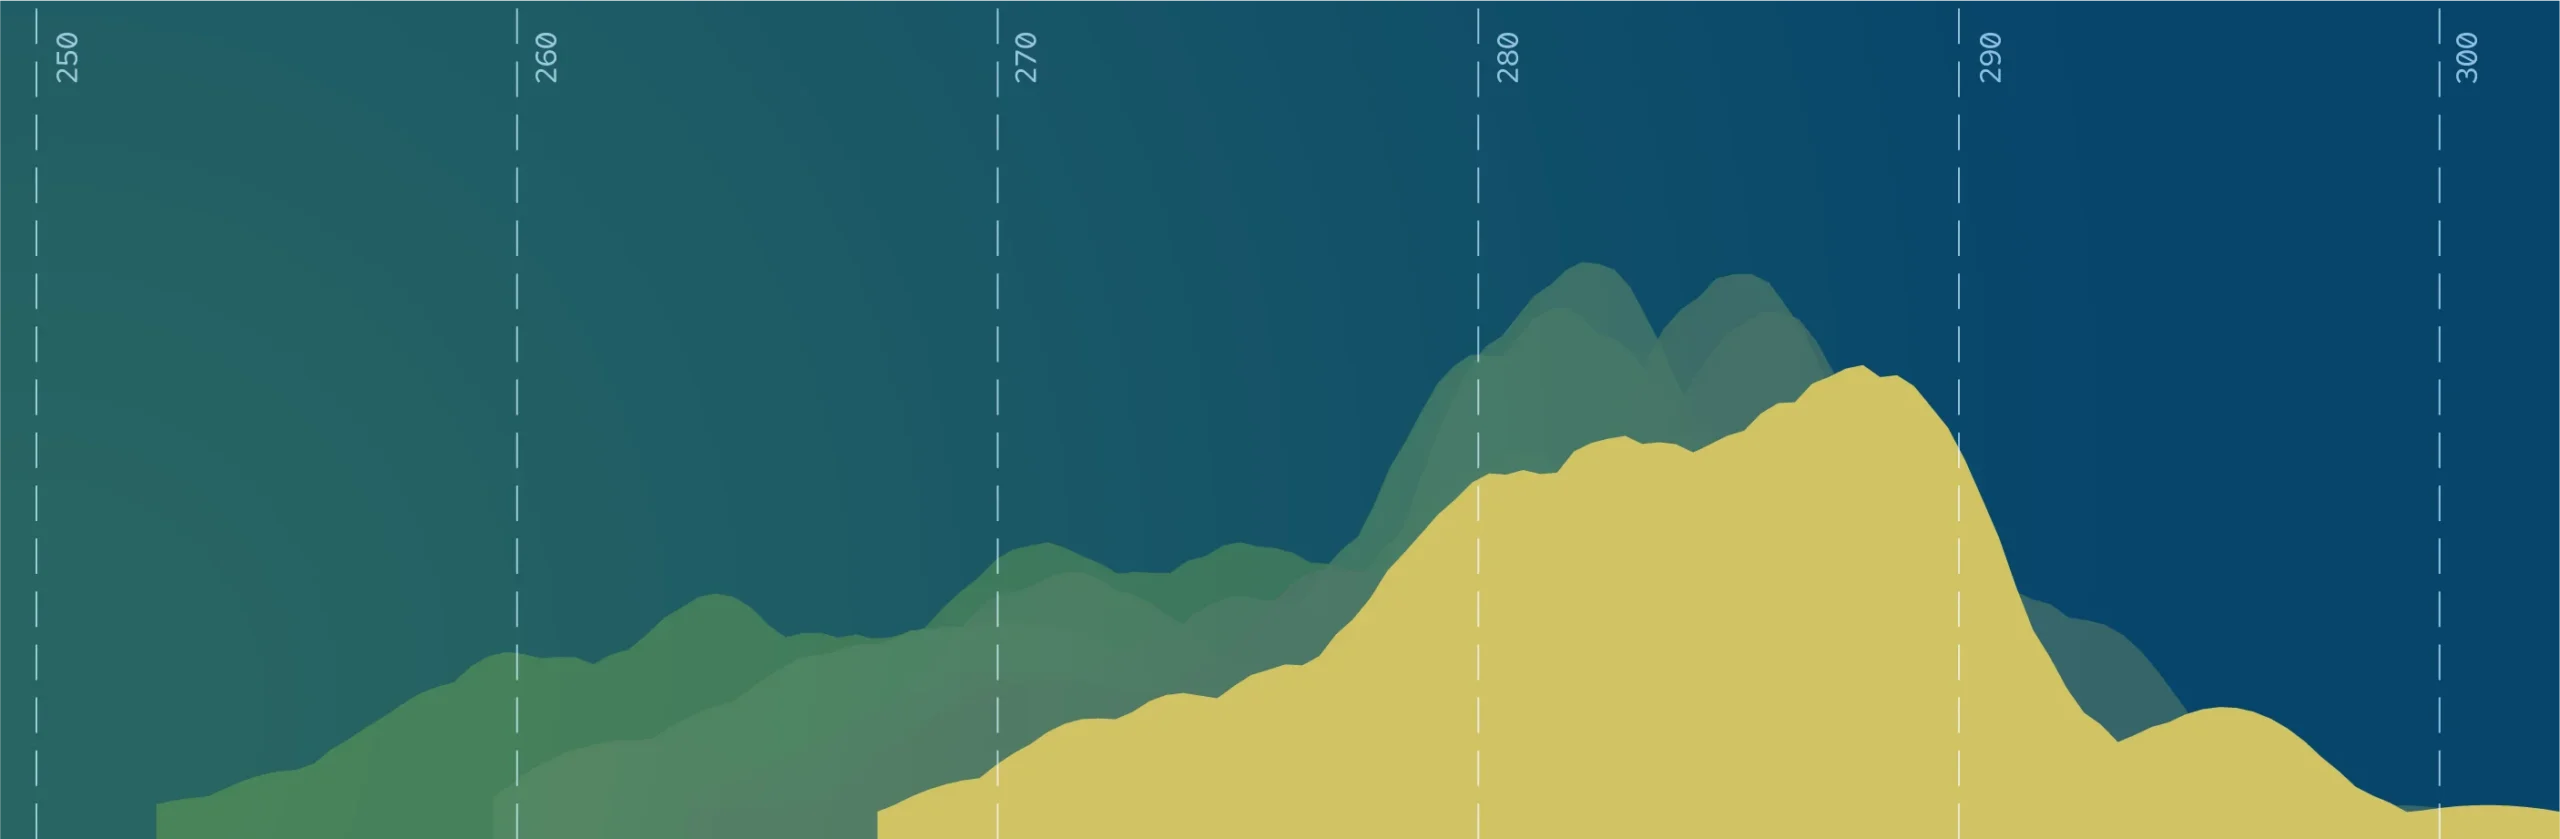
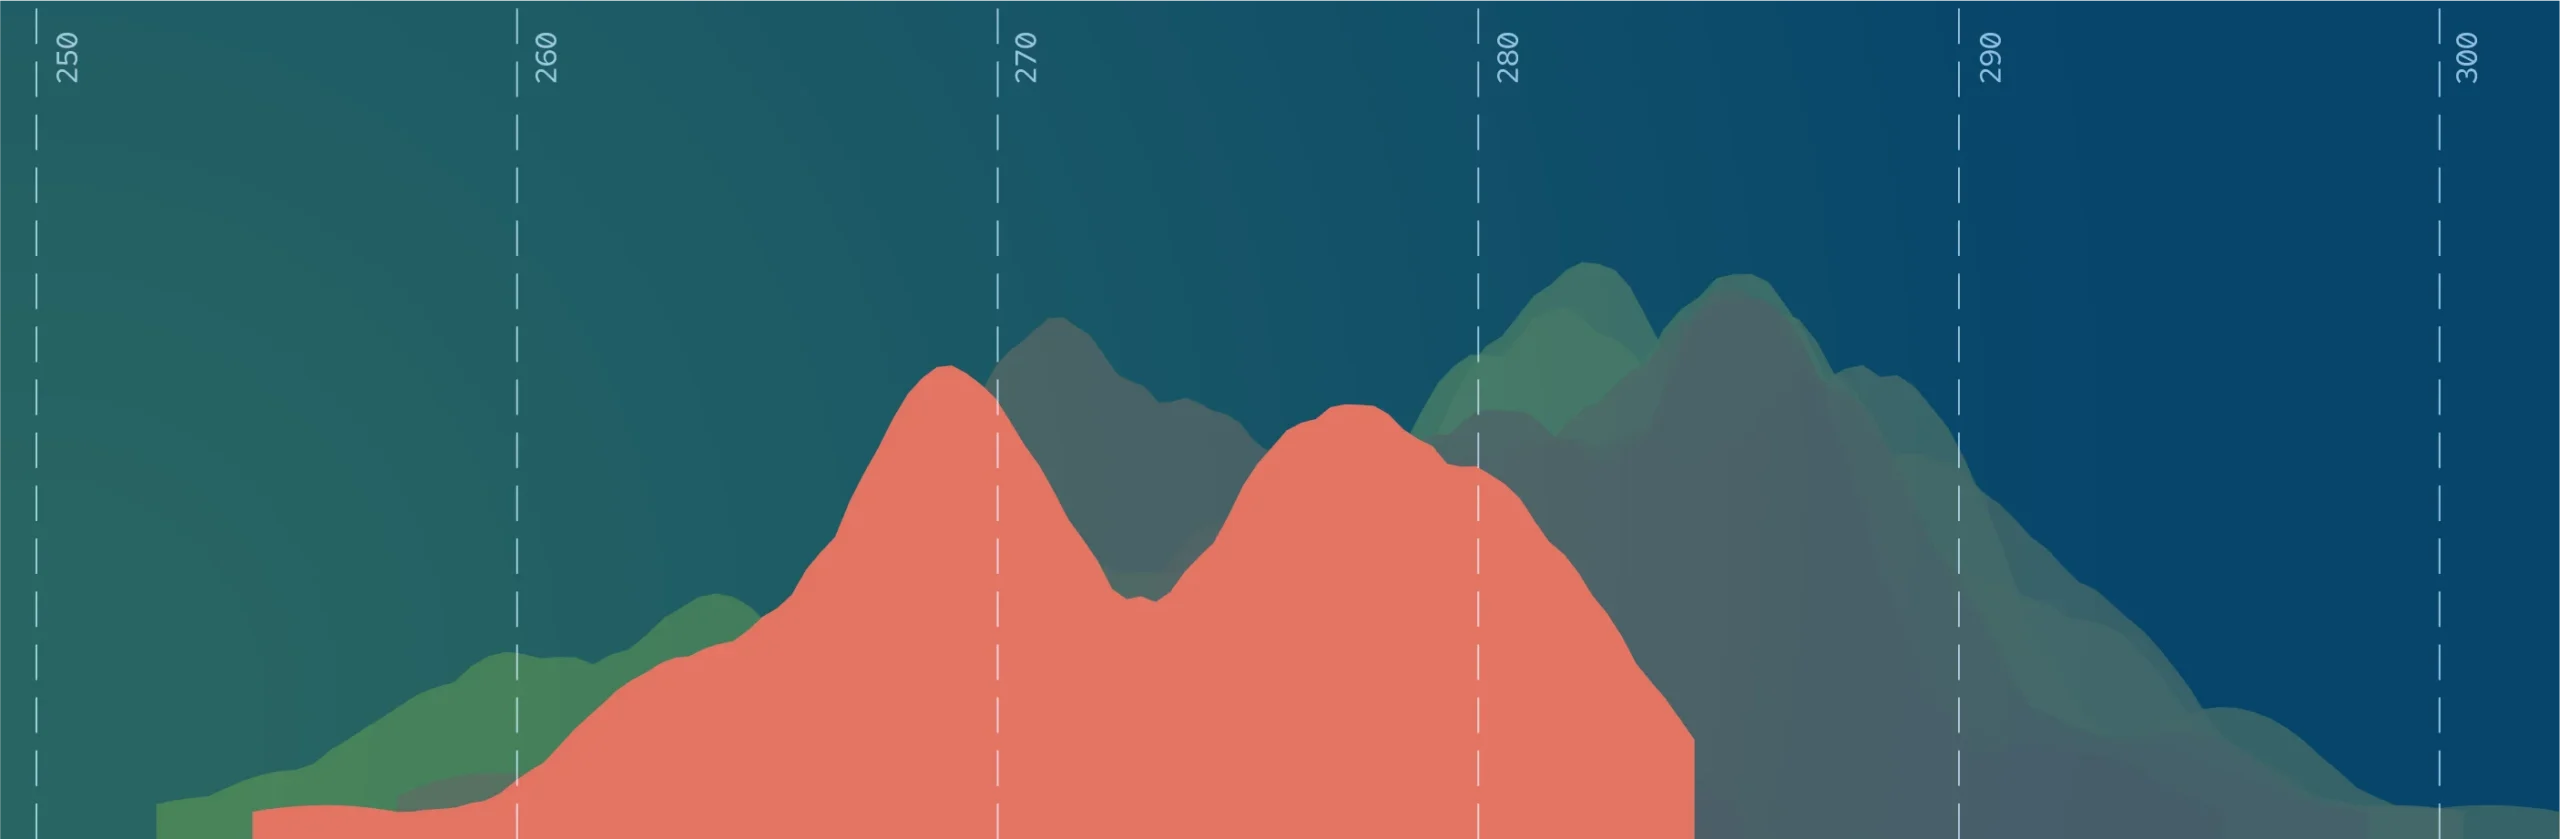
Each ridgeline represents the distribution of state average scores on NAEP eighth-grade math in a given year. A ridgeline shifted to the right means states are performing better overall. A higher peak with a narrower base means less variation between states.
State Performance and Variation Over Time
Density of states’ average scores in NAEP 8th-grade math over time, 2000-2019
Hover or tap over each year to see how scores have changed.
From 2000 to 2013, the nation had made progress in two dimensions at once: the ridgeline shifted to the right, signaling better overall performance, and it simultaneously became higher and narrower, meaning more equal outcomes.
DoD and DC excluded from figure
Average NAEP Scale Score
From 2000 to 2013, the nation had made progress in two dimensions at once: the ridgeline shifted to the right, signaling better overall performance, and it simultaneously became higher and narrower, meaning more equal outcomes.
DoD and DC excluded from figure
Average NAEP Scale Score
From 2000 to 2013, the nation had made progress in two dimensions at once: the ridgeline shifted to the right, signaling better overall performance, and it simultaneously became higher and narrower, meaning more equal outcomes.
DoD and DC excluded from figure
Average NAEP Scale Score
From 2000 to 2013, the nation had made progress in two dimensions at once: the ridgeline shifted to the right, signaling better overall performance, and it simultaneously became higher and narrower, meaning more equal outcomes.
DoD and DC excluded from figure
Average NAEP Scale Score
From 2000 to 2013, the nation had made progress in two dimensions at once: the ridgeline shifted to the right, signaling better overall performance, and it simultaneously became higher and narrower, meaning more equal outcomes.
DoD and DC excluded from figure
Average NAEP Scale Score
From 2000 to 2013, the nation had made progress in two dimensions at once: the ridgeline shifted to the right, signaling better overall performance, and it simultaneously became higher and narrower, meaning more equal outcomes.
DoD and DC excluded from figure
Average NAEP Scale Score
From 2000 to 2013, the nation had made progress in two dimensions at once: the ridgeline shifted to the right, signaling better overall performance, and it simultaneously became higher and narrower, meaning more equal outcomes.
DoD and DC excluded from figure
Average NAEP Scale Score
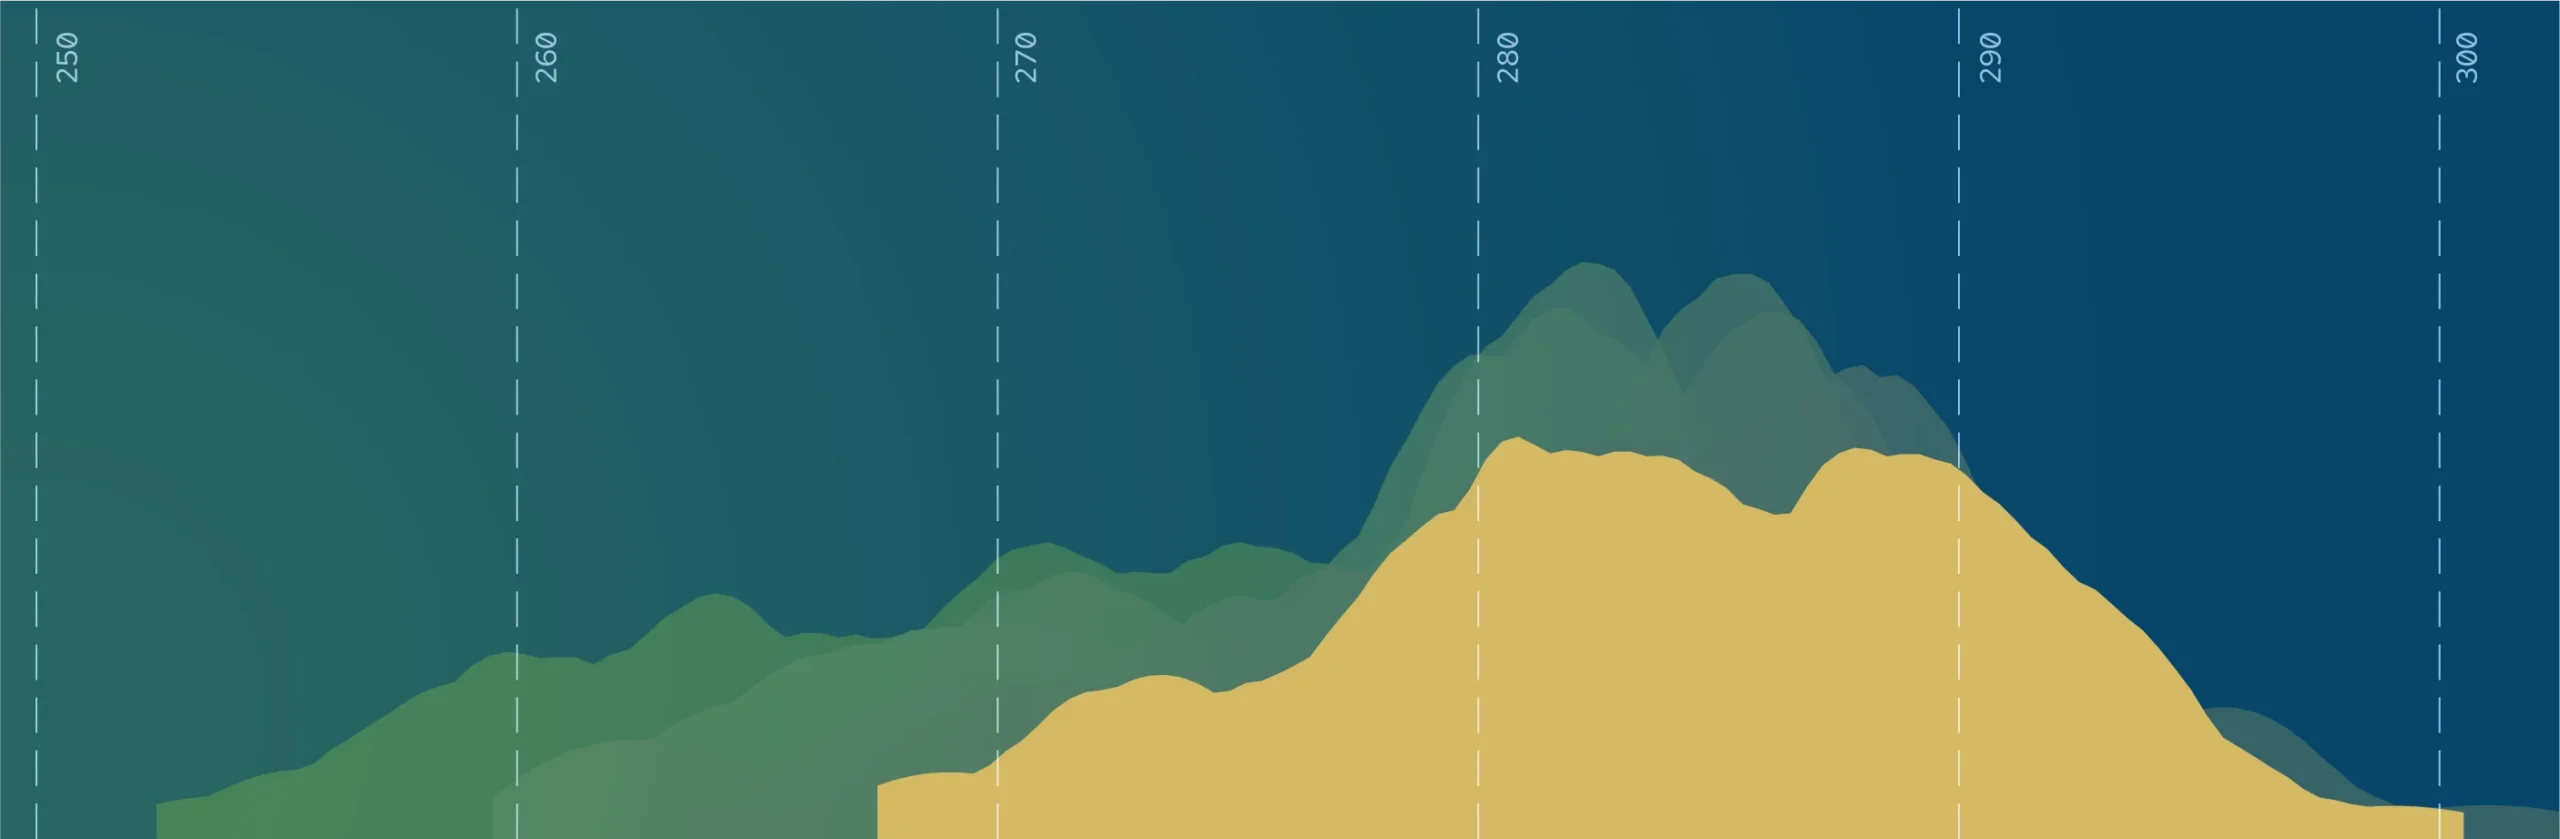
From 2013 to 2019, overall achievement had begun to decline, but the narrowing trend continued, meaning states were still becoming more equal even as their average performance fell.
DoD and DC excluded from figure
Average NAEP Scale Score
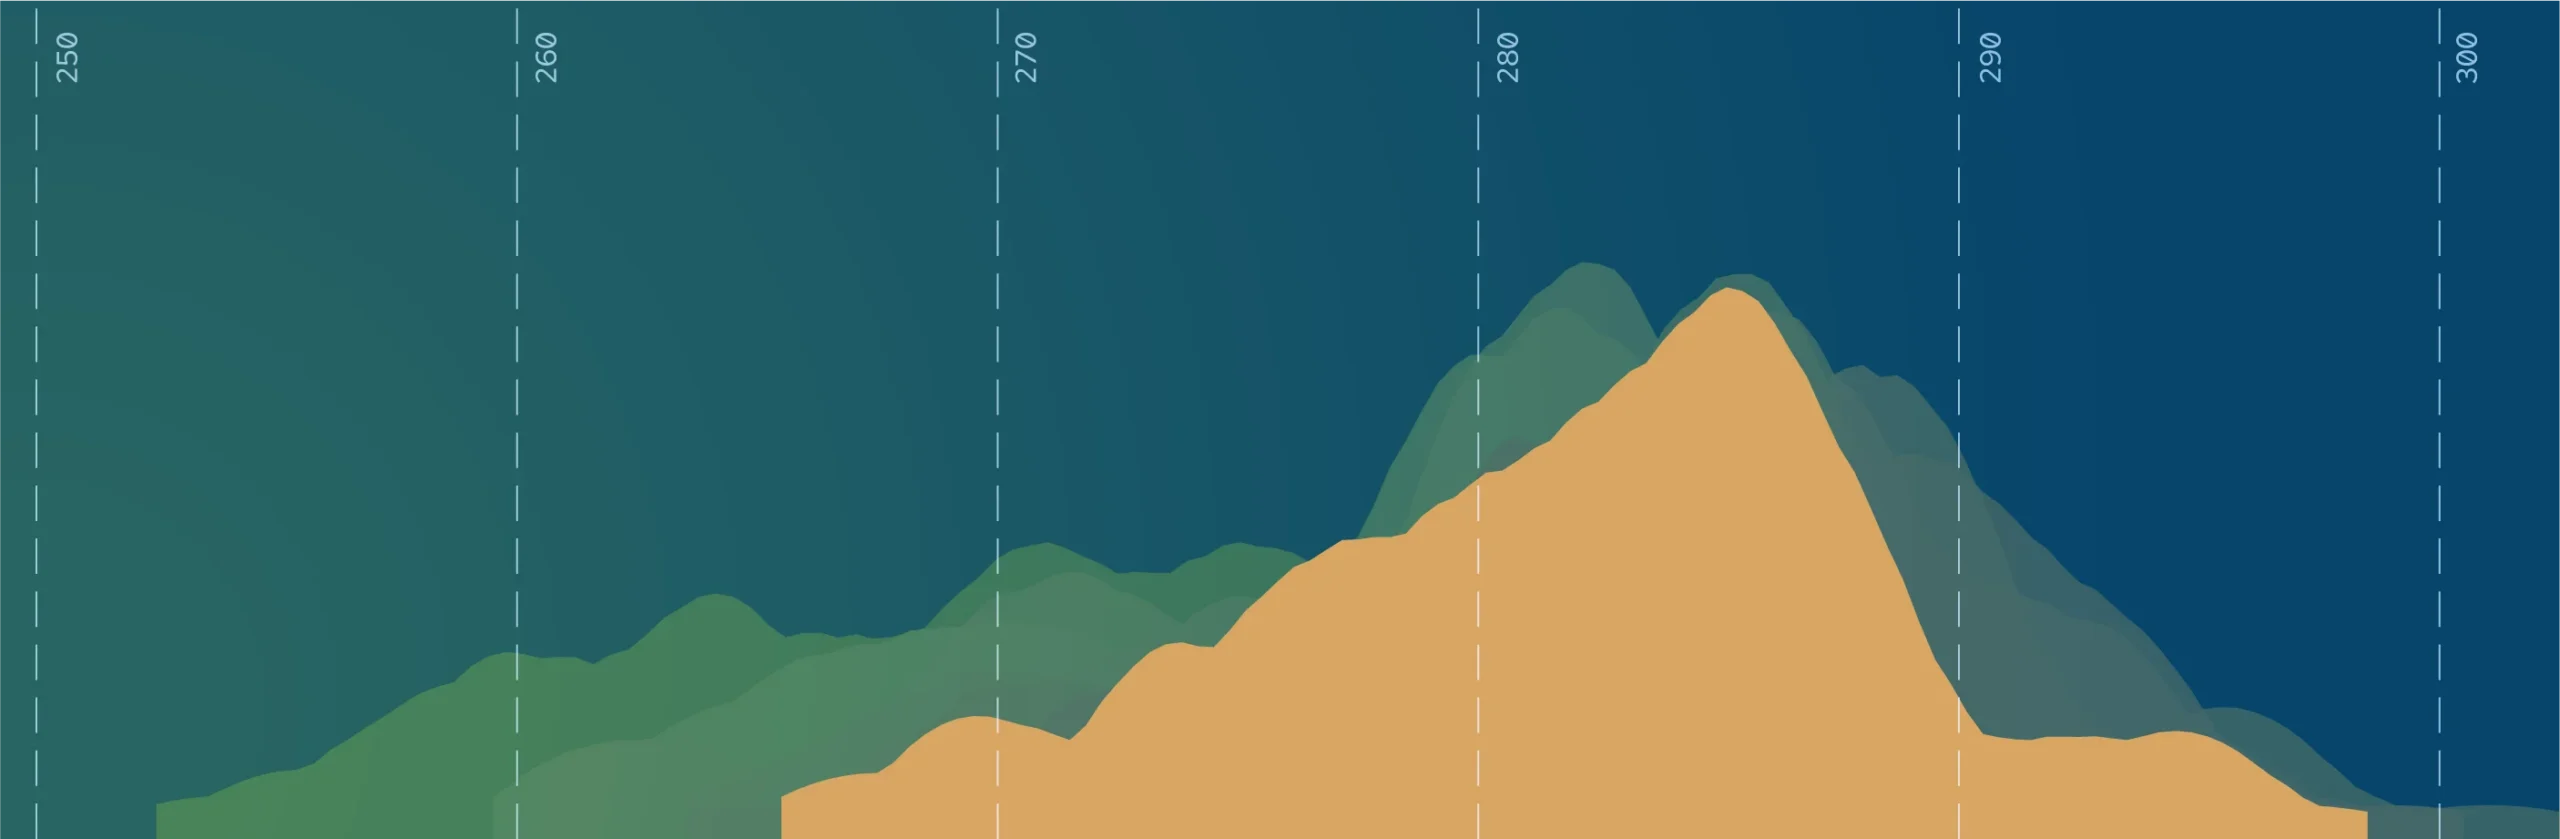
From 2013 to 2019, overall achievement had begun to decline, but the narrowing trend continued, meaning states were still becoming more equal even as their average performance fell.
DoD and DC excluded from figure
Average NAEP Scale Score
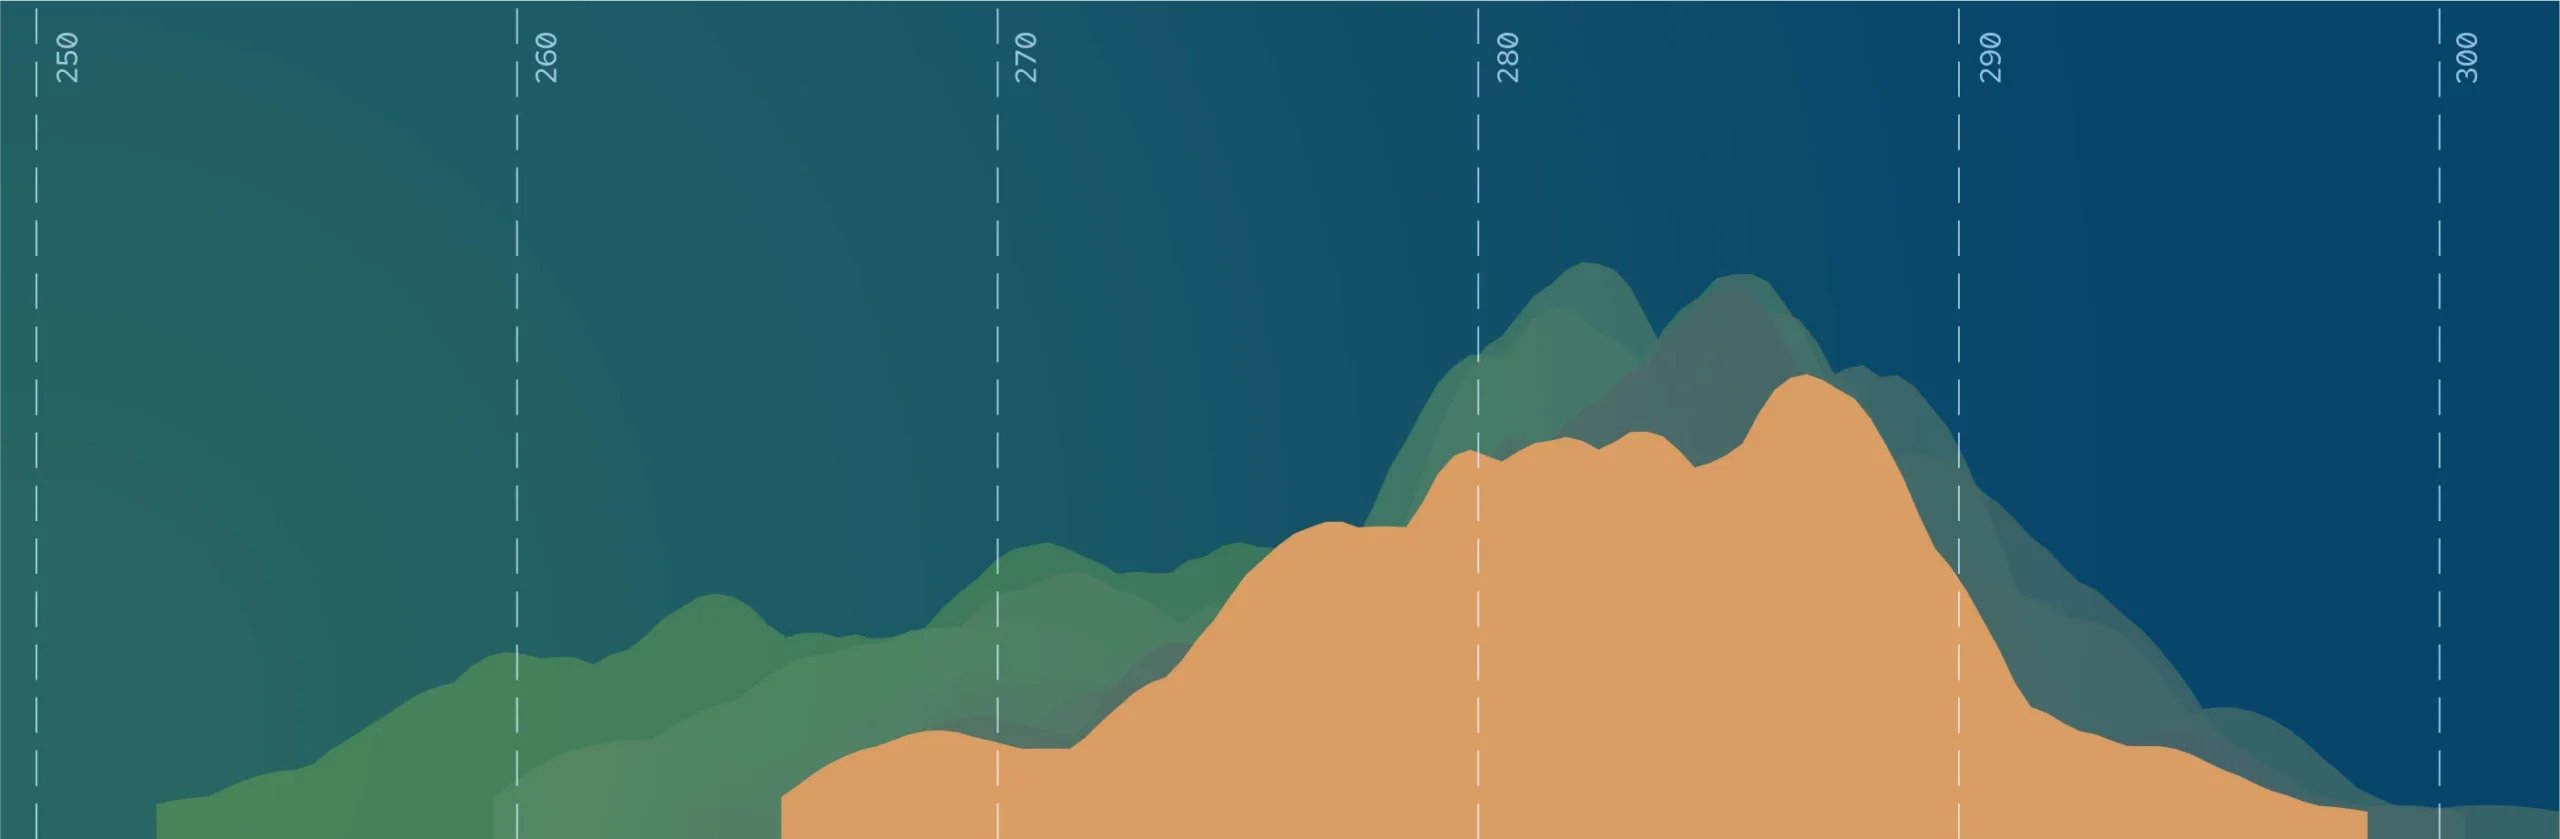
From 2013 to 2019, overall achievement had begun to decline, but the narrowing trend continued, meaning states were still becoming more equal even as their average performance fell.
DoD and DC excluded from figure
Average NAEP Scale Score
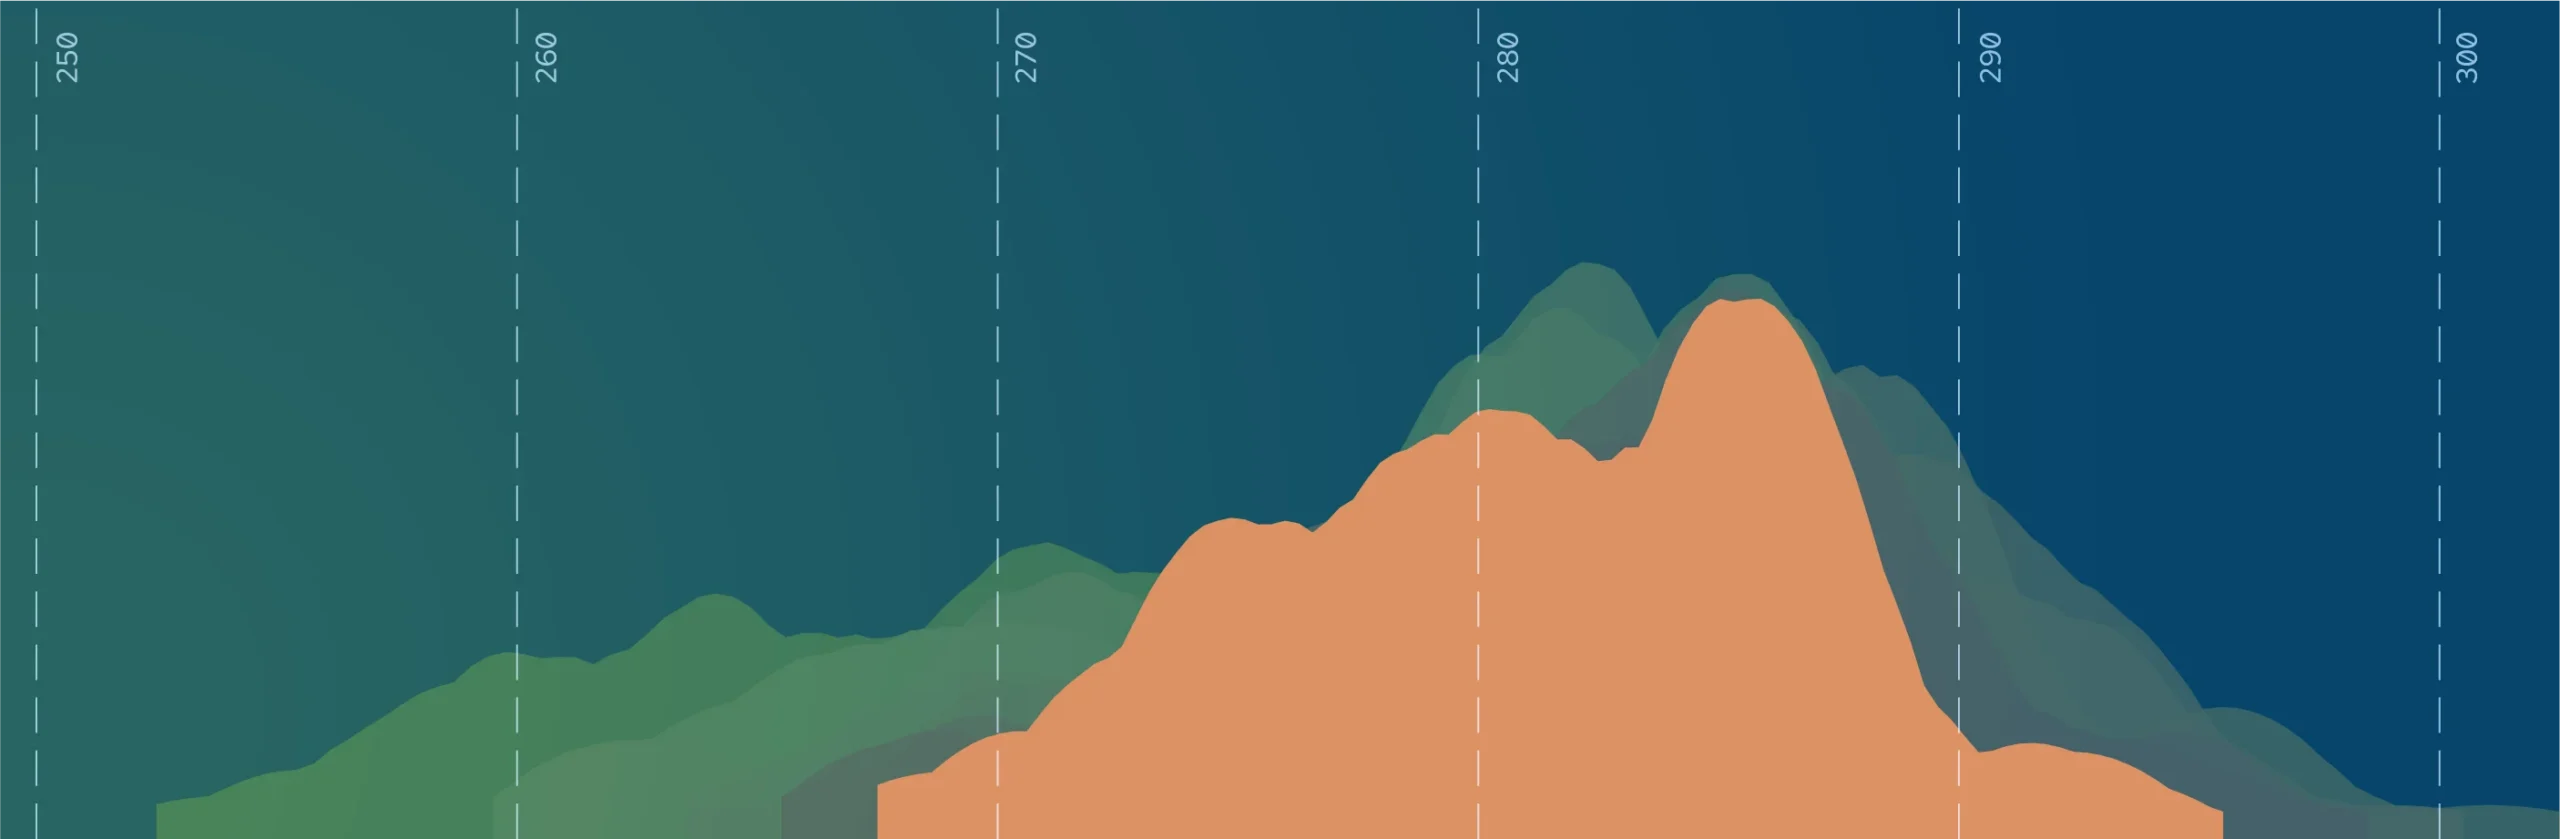
Then the pandemic reshaped the trend. By 2022, not only did scores sharply drop, but the ridgeline widened and flattened, meaning variation between states had increased. In 2024, performance continued to decline, and variation continued to grow.
DoD and DC excluded from figure
Average NAEP Scale Score
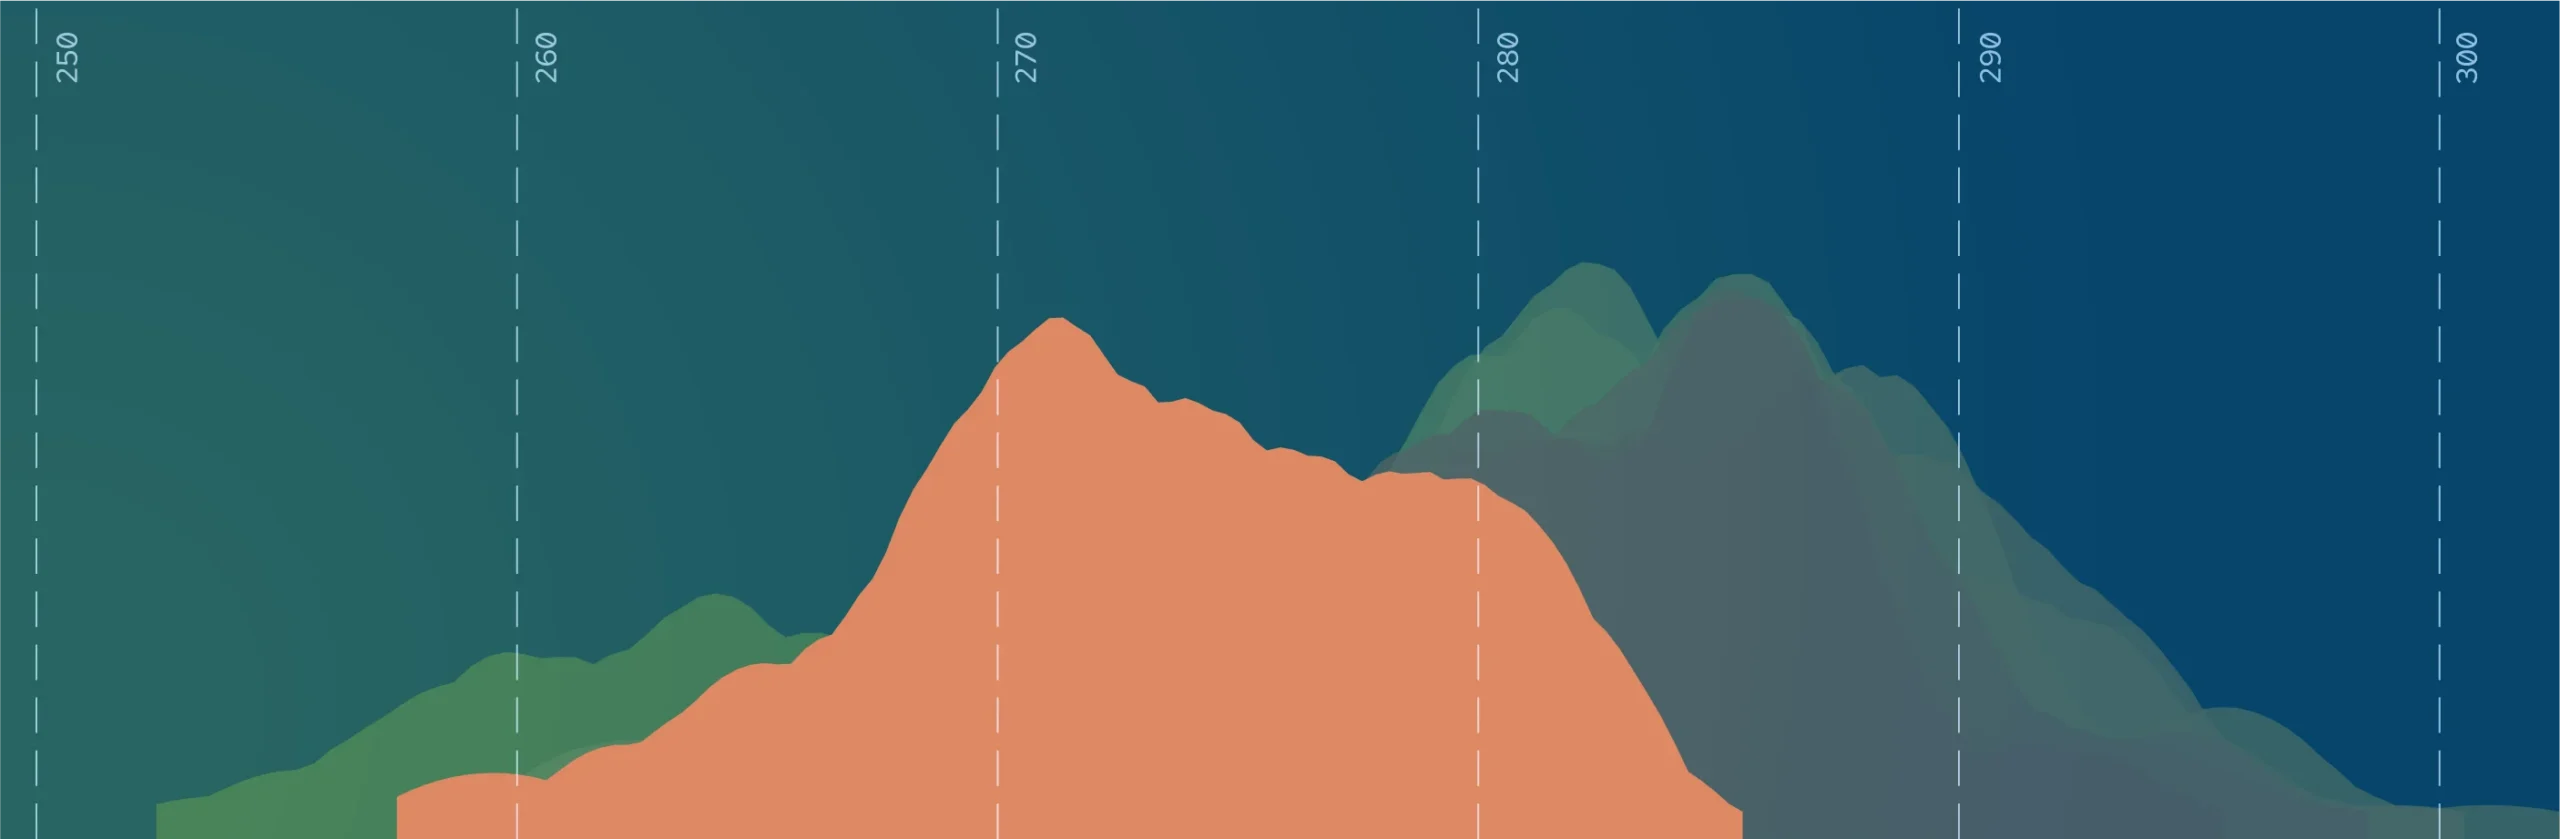
Then the pandemic reshaped the trend. By 2022, not only did scores sharply drop, but the ridgeline widened and flattened, meaning variation between states had increased. In 2024, performance continued to decline, and variation continued to grow.
DoD and DC excluded from figure
Average NAEP Scale Score
What must happen next
The policy environment has not kept up with the pace of change, so the moment is now. We really need to light the fire of urgency around these issues.
– Margaret Spellings, President of the Bipartisan Policy Center (Education Week)
The students who most need states to get this right have the least power to demand it. These students are in school right now, in too many states where leaders appear ambivalent to growing inequality and declining achievement. Our students deserve better, and that means state chiefs and elected officials, funders and advocates, national leaders, political organizers, and researchers must pursue five priorities.
State leaders
Audit your current improvement strategy, patch its holes—especially in math and AI—and focus on implementation.

Funders and advocates
Hold states accountable for their improvement strategies and follow-through.
National leaders
Reimagine and reestablish the federal government’s role.

Political organizers and strategists
Rebuild a genuinely bipartisan coalition for evidence-driven reform.
Researchers
Grow the evidence base for effective, strategic state leadership.


More from CRPE
Phoenix Rising
CRPE’s Phoenix Rising series is a collection of essays and reports aimed at charting a new path forward for U.S. K-12 public education. Spurred by changing state responsibilities and a shifting federal landscape, the series serves as a public forum to challenge old assumptions and debate a modern education reform agenda. It brings together leading education experts to explore future-focused topics like precision learning, school choice, AI integration, and the restructuring of state education systems.